Golf is hard… Why not start there? It seems to be a refrain I continue to stress. This season those words were particularly fitting. I struggled.

The highlight was my lone win on the local Dallas tour last November. The remainder of the year I was seldom in contention and really struggled to score. I found new ways to throw rounds away. I did it off the tee, I did it with the flatstick, I did it with the irons. I’ve felt close all year but somehow couldn’t get it together. Instead I’m left with ‘moral victories’ and reassuring myself that I am close.
Despite the lack of results, the golfing year was not a total loss. There was plenty to be learned. For starters, I am constantly learning how to play better golf with less golf. The balance of working full time, spending lots of time with my young son / family, and not ignoring the wife is one that does not lend itself to lowering a handicap at my level (or any level). Contrast that with the guys I am competing with and it’s difficult. A combination of college kids, semi-retired guys with money, and players with older families. Any way you slice it I am competing with guys that are playing more than I am. I am not complaining, just stating a reality. I have to learn to be efficient with practice and efficient on the course. Luckily, I’m an engineer. I specialize in making things efficient.
I’m certainly not the only one in this bucket. Anybody who has a family and loves golf (or other hobby) has the same struggle. I just know that I am still learning how to balance life and play better golf. It didn’t come across this year, but I’m learning. I’m getting better. I also have some advantages that others may not have… A very understanding wife who likes to travel and supports my playing, a son who is starting to show interest in the game, and I recently built a practice facility in my back yard (more on that another time).
So I’ve got hope, it’s time to make a plan to improve. Step one is to identify where I need work. This includes the 6 inches between my ears, which is probably where I lost the most strokes this season. Time to review 2015…
The season couldn’t have started better. I won my first event of the season by 3 strokes in difficult winter conditions on a course I tend to play well. However, as the new year rolled around I saw my play start to decline and I fell into mediocre scores where I failed to break 80. Not good for a low single digit handicap. It was also around the March timeframe that I started using tools like Game Golf to really track my play statistically. Unfortunately, the desire to track stats and only playing in tournaments led to too much pressure and frustrating finishes. My true golf was not coming through.


2015 Scoring
The scoring is clearly all over the place. After showing a nice trend early, something clearly changed after Castle Hills and I couldn’t break 80 to save my life. It got bad enough that for a while I stopped tracking my stats as I didn’t see any value in analyzing the garbage I was putting out. Basically, if I was performing to a reasonable level the data could tell me where to improve, however when you’re playing hockey on the greens and hitting tee shots in the water, you don’t need advanced analysis to know where to improve. It was bad.
Since I did collect some data, I might as well look at it. While the data is skewed towards poor scoring, it is still interesting to see what part of my game correlates to score. In the end, score is all that matters. So what has the biggest impact on the end product? Is it putting? Driving? Irons? Short game? Fairways? Fear not… I have the answers.
First I looked at strokes gained. For me I kept track of strokes gained in 4 categories… 1) Tee shots. Straightforward, this is all shots hit from a tee box including par 3s. 2) Midgame, which is any shot that is >75 yards and not on a tee. 3) Shortgame, any shot that is <75 yards and not on the green. 4) Putting, all shots from the green.
 Of the four categories, midgame (or iron play) had the greatest correlation with score. This surprised me. I tend to feel like bad rounds are dominated by poor tee shots or missed putts. While those certainly don’t help, the impact of putting on my overall score is minimal. Or to put it another way, my putting performance is consistent and doesn’t tend to vary as much from round to round. Short game has almost no correlation. I don’t tend to see really good or really poor performances that impact score. You can tell that putting and shortgame have the least impact just by looking at the y-axis. Despite my scores varying by 17 strokes or so from best to worst, the strokes gained for putting and short game is within 4-5 strokes. Contrast that with midgame and tee play, and my strokes gained varies by closer to 12 strokes of impact from best to worst.
If you combine all ball striking (basically everything but putting), there is strong correlation of course. Basically confirming that good/poor putting only seems to change my score by +/-1.5 strokes.
 Now intuitively this makes sense. Another thing I’ve seen in the past is that the number of greens in regulation that you hit should correlate with score. The problem that I have with that statistic is that I have always seemed to score higher than this article suggests for a given number of greens. I guess that means that I am either a poor putter, or I do not scramble as well as the average player. Based on my strokes gained stat, I have a hard time believing that. In any case, my scores do correlate with the number of greens I hit as shown below.
 There are several things that show virtually no correlation to score, these include fairways, scrambling, feet of putts made, and number of putts. All this is well and good, I see where score correlates, but how did that translate throughout the year? Well, I can look at strokes gained by area per round.
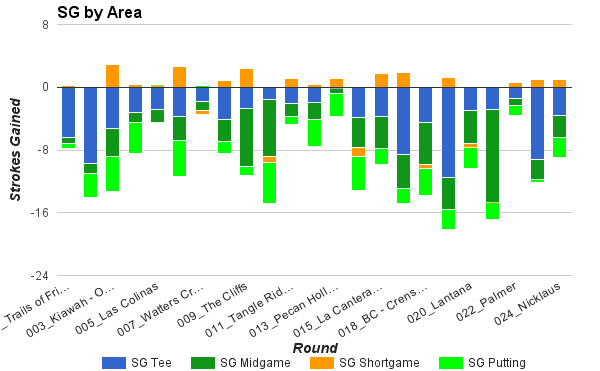 Alright, so how do I interpret the pretty colors?… Well, anything below 0 is losing strokes (to a PGA Tour average). Anything above 0 is gaining strokes (for me that is a strong short game). The size of the bar shows the amount that I am losing for a given category. So when I look at the above plot, it tells me what I felt intuitively. It tells me that I lost a lot of strokes (high scores) in most of my rounds and that I did it in different ways. Sometimes play off the tee was the biggest contributor, sometimes it was ironplay (SG Midgame), at other times even putting snuck in there. About the only thing that didn’t play a large factor is short game. Ideally, I would see that ironplay dominated and I could go work on that, but my problems were not consistent this year. Mainly because they weren’t as much swing related as they were mental. I had doubts that came across in my swing. I didn’t feel like i was playing or practicing enough and so I struggled to make confident and committed swings. On the rare occasion I did strike the ball well, I threw it away with the putter. I expected to play poorly and this manufactured a reality. This led to pressing even more and falling into bad habits. When I finally broke down and turned to video analysis late in the season I saw some habits I did not like. In particularly my head dropping way too much in the transition.
With a little practice and swing review, I broke out of the poor mindset at Nationals and actually played some good golf, particularly the last three days. However, I still had some big numbers that held back some of the scores from being what they could have been.
I’ll make another post to show how much fun I had at Nationals and why I think my play improved. In the meantime, my battery is recharged. I’m excited about where my game is headed again. 2016 is going to be a season of redemption.
